Twelve Excel Timeplans, One Gantt: Everyone Keeps Their Own File
A programme plan is split across levels and owners, and each owner works in their own Excel file — which is correct, because they own their dates. Nobody has the whole picture. This is the file that reads all twelve of them at once.
Every large programme is planned the same way. One master plan at the top, one plan per workstream below it, one per supplier below that. Each lives in a separate Excel file owned by a different person, and that is the right arrangement: the person who knows when the tooling arrives should be the person who types that date.
What goes wrong is the view. To see the whole programme somebody copies twelve files into one deck by hand, and by the time that deck is finished it is a week old. The dashboard leaves every owner's file exactly where it is. It reads them all, draws them together, and reports the four things that are genuinely hard to see across separate files: what is stale, what is broken, what has moved since the last review, and what else has to move because of it.
The rule everything else follows from
Every owner keeps their own file, and an edit made in one plan can never modify another. That single rule decides most of the design: why it reads a folder rather than importing into a database, why saving rebuilds each workbook separately from its own bytes, and why nothing on the plan ever moves on its own.
So what? A tool that quietly rewrites somebody else's dates gets switched off after the first review meeting. One that only ever shows them gets trusted.
What is in the folder
Two more folders appear inside 03_Time_Plans as you use it: _baselines/ for the dated snapshots, and 04_Archived_Timeplans/ for the version each file replaced. Nothing in the code hardcodes any of these names — rename them freely. Six example timeplans ship with it, so it draws something the moment you open it.
One file per timeplan
Copy the matching template into the plans folder and rename it: L3_TEMPLATE.xlsx becomes L3_Tooling.xlsx. The file name sets the level and the order — L1 to L5 places the plan in the stack, and the word after it orders plans sharing a level. Several files can share a level.
Each file has three sheets. The description sheet carries the header block — Project Name, Project Code, SoP, Timeplan Name, Timeplan ID, Timeplan Owner — plus the Timeplan range (the first and last week the Excel Gantt draws) and a Today box, both of which fill themselves in. The input sheet is where the owner types, and it is the only sheet the dashboard reads or writes. The time plan sheet is that plan's own Gantt, drawn in Excel by formulas — nobody types in it. So each file is a usable timeplan on its own, with or without the dashboard, which is what makes it reasonable to ask twelve people to adopt the template.
On the input sheet the owner types the activity, the responsible person, the department and location, a Planned start/end week and — once work is actually under way — an Actual start/end week, plus one Status from a six-value dropdown: Planned, In Progress, Completed, Cancelled, Bypassed, Revised Plan. Beside it sits Tracker, a formula nobody types in — but it is not a lateness check against today's date. It is a fixed second word for whichever Status was picked: Planned reads Yet to Start, In Progress reads On track, Completed reads Delayed Start, Cancelled reads Delayed finish, Bypassed reads Blocker, Revised Plan reads Risk, and a blank row reads As per plan. Status is what a person chose; Tracker is Excel and the dashboard agreeing, by an identical formula on both sides, on what that choice is called.
Two more columns, Colour (Planned) and Colour (Actual), each a Red / Yellow / Green / Blue / Purple dropdown, set what the two bars draw in — the convention is to pick the same colour in both. On the time plan sheet's own Gantt, and in the dashboard, the Actual bar is solid and full height; the Planned bar is a thinner stripe drawn on top of it, in a lighter tint of the same colour rather than a plain copy of it, so pale versus solid is what tells the two timelines apart, not just thickness. Leave Actual blank until the work starts or finishes and the dashboard shows only the pale Planned bar, full height — once both are filled in, the gap between the pale bar and the solid one is exactly how far the real work has drifted from schedule, visible without reading a single date.
The sheets are wired together by cell position, and none of them is protected any more, which is why the template ships with a short list of rules: do not insert or delete rows or columns, do not cut cells or drag them, do not sort, do not type in the Tracker or on the time plan sheet. Every one of those moves values out from under a formula, and it fails quietly rather than loudly.
Two header fields do more work than they look like they do. Timeplan ID is set once and never changed, so dependencies and baseline comparisons keep working even after a file is renamed. Last updated is the freshness stamp, and in the current templates the cell fills itself in, so nobody types a date and nobody forgets to. The dashboard reads it, flags any plan older than two weeks, and writes the date itself only where that cell holds a literal rather than the formula.
So what? "Nobody has touched L4_Logistics for 49 days" is a fact no amount of staring at a Gantt will give you, and it is usually the most useful line on the screen.
Dependencies are written in plain text
Nobody is going to learn a syntax to use a planning tool. So a dependency is the file name, a hyphen, and the number of the activity this one waits for, typed into a normal cell:
Separate several with a semicolon. The activity name works instead of the number (L1_Programme-Gate 2 review), and a bare number or name means "in this same file". Use the number — it is matched first and can never be ambiguous. Every activity's exact reference is printed in the Ref column of its own tab, ready to copy.
Anything that does not match is listed under Risks, in the File checks tab, and drawn as a red chip with the file and row it came from. It is never silently dropped. A typo in a dependency is a planning error, and the tool's job is to put it in front of a person.
So what? A check that names the file and the row gets fixed. "3 dependencies could not be resolved" gets ignored.
What the dashboard gives you
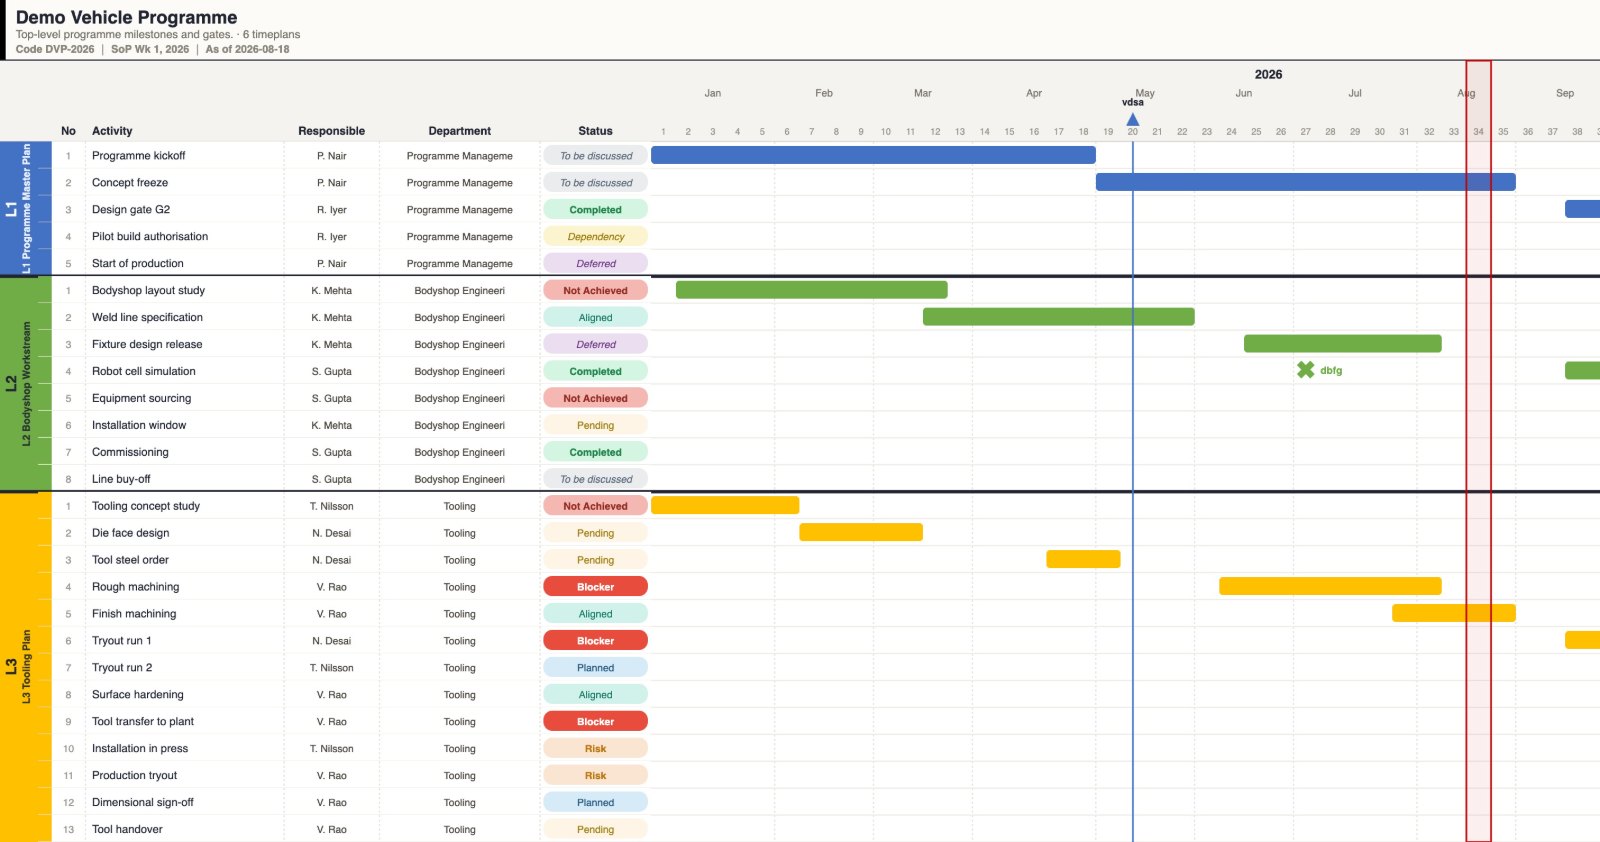
| Panel | What it does |
|---|---|
| Files | Pick the source folder, reload after an owner updates their file, change folder, clear. The last folder is remembered, so it reopens where you left off. |
| Save to Excel | Lists exactly which timeplans changed and what changed in each, then writes only those. |
| Export | SVG, PNG and a landscape PDF of the current view in Letter, A3 or A2, plus one printable status sheet per timeplan — its activities, its own checks and a sign-off line. |
| Risks | Three tabs: what is late or waiting on something unfinished, what else has to move because something moved, and what is wrong in the files themselves. Filter by severity or by one timeplan. Green when clean. |
| Baseline | Freeze today's dates, then see what has moved since — against today, or against a second capture. |
| Timeplans | One row per file: show/hide, rename, age in days since the owner last saved it, activity count, warning count. |
| View | Compact timeline, which columns to show, and a snapshot window that crops the view and every export. |
Double-click any bar or table row to change its start and end week and, optionally, its status, name, responsible or location. Pending changes show in red until you save.
Two things on the screen belong to the dashboard rather than to anyone's workbook: the programme heading above the table, and the milestones marked on the week axis — a gate, a sign-off, a build date, each with its own symbol and a line down the plan. Neither is ever written into a timeplan. Both persist locally, and Save settings writes them, along with which plans are shown, into a single Dashboard_Settings.json beside the plans, so everyone opens the same view. That file is shared, so the last person to save it wins — worth nominating one owner of the team view.
Baselines, and what has moved
Capture freezes the start and end week of every activity in every loaded file, exactly as they are at that moment, and stores it as a dated snapshot. Nothing on the plan moves and nothing is written into the timeplans.
Switch Baseline view on afterwards and the difference is drawn in place: a dashed outline where the activity used to sit, and a badge for how far it moved — +3w is three weeks later, −2w is two weeks earlier. Every snapshot is kept, named by month and numbered when there is more than one that month, and two dropdowns set what is compared: from a capture, to today's live plan or to a second capture. "What moved between the June and the August review" becomes one question instead of an afternoon.
Activities are matched on Timeplan ID first, file name second, then activity number — so renaming a file or an activity does not break the comparison.
Knock-on effects
Movement matters less than its consequences. The Delays tab takes every activity whose end date differs from before — an unsaved edit of yours, or a move away from the selected baseline — and follows the dependencies downstream, flagging two things:
Each one is listed with the owner of the plan it lives in, because the next step is always a conversation with a specific person. Print report and Save report as file produce a two-part document — what changed, and what that affects — to take into the review. One four-week slip in the example data flags 49 downstream activities.
Nothing is changed automatically. The dashboard follows only the links people actually wrote down, and the decision to move a date stays with the owner of that date.
So what? The four questions separate files hide are the only four the master plan exists to answer. Everything else in the tool is in service of those.
Saving, and how old versions are kept
Reading is easy. Writing back into twelve workbooks people rely on is not, so the save path is the most conservative part of the tool.
Each changed timeplan is rebuilt from that file's own bytes, so an edit in one plan can never touch another, and every formula, conditional format, colour and dropdown in it survives. Before anything is overwritten, the version being replaced is copied into the archive folder as 2026-08-08_1432_L2_Bodyshop.xlsx — date, time, then the file name, so copies sort oldest to newest. Only then is the new version written. If the copy cannot be made, the save stops and the original is left alone.
Every rebuilt file is re-parsed and verified before anything is committed; if one value does not round-trip, the whole save aborts. And if any file changed on disk since you loaded it, the save stops and asks you to reload first — so you cannot overwrite somebody else's work by accident.
Using it
Limits
Chrome or Edge for folder loading and saving in place. Firefox and Safari can load files and will download the saved ones instead. The templates are formatted and formula-filled for about 200 activities per timeplan — past that the dashboard still reads up to 2000 rows, but Risks tells you to copy the last row of that file's own time plan sheet down, or its dropdowns, Tracker formula and Excel Gantt stop working past row 207. Twelve files of 200 activities is 2400 activities and is fine. The grid draws up to 700 weeks, about thirteen years.
And there is no scheduling engine: no resource levelling, no critical-path optimisation, nothing that reflows the plan for you. Those need a single shared source of truth and a single owner, which is exactly what this arrangement does not have.
Where the AI actually helped
This one is a single HTML file with no build step and no libraries, which means every part of it — the .xlsx parse, the rebuild that preserves formulas and formatting, the dependency resolver, the Gantt renderer — is hand-written. That is a lot of surface for a tool built alongside a day job, and Claude was a pair-programmer on all of it.
The rebuild path is where it earned its place. Writing an .xlsx back so that formulas, conditional formatting and data validation survive means editing the parts of the package you changed and leaving the rest byte-identical, and getting that subtly wrong produces a file that opens with a repair prompt — which, in a shared folder, is how a tool loses everyone's trust in one afternoon. Working through that with a second party, and then adding the verify-by-re-parsing step and the dated archive before it, turned "probably fine" into something I was willing to point at other people's files.
The other half is the documentation. The repository carries a full technical reference — data model, the parse and rebuild path, dependency resolution, the baseline format — which exists because writing it was cheap. A tool that twelve people depend on and only one person understands is a liability, and the version of this project without an AI in it is the version where that reference never gets written.
So what? The pattern across both tools is the same: the AI did not build things I could not build. It made the careful version — the parser, the audit, the verify step, the documentation — cost about the same as the careless one.
The dashboard as one self-contained HTML file, the blank L1–L5 Excel templates, twelve example timeplans, and the full technical reference.
github.com/srivastav-ayush/timeplan-dashboard ↗